发新话题
打印【有0个人次参与评价】

[大势] 看看人家老外分析的上证走势图

看看人家老外分析的上证走势图

看看人家老外分析的上证走势图(附中文翻译)


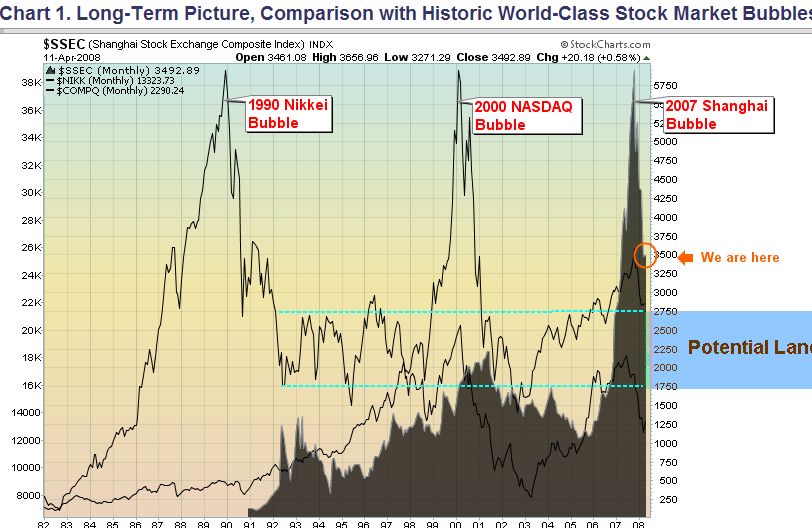
Chinese Stock Market, The Big Picture of Turbulent Waves
  
  Long-term, intermediate-term, & short-term analysis of the Shanghai Stock Exchange Composite Index
  
  The Chinese stock market is not in a vacuum of its own. It is exposed to the environment with a growing risk of inflation in China and a growing risk of recession in the United States, which could be two major fundamental precursors for potential worldwide stagflation. One may think that the Chinese market is still bullish for a long term and just bearish for a short term. On the contrary, the charts here with a spectrum of timeframes suggest that the Shanghai Index currently is in a significant downtrend with a long-term bearish perspective, but it may have a potential counter-trend rally with a short-term bullish bias. Up-and-down is the nature of the stock markets; there are always bumps on the way to either direction. This is a very volatile market. Careful evaluation of investment/trading projections and portfolio exposures within proper timeframes or time horizons could be critical.
  
  (意译,下同)上证指数的长期、中期与短期波浪分析
  
  中国股票市场并非存在于真空之中,它面临着日见增长的国内通胀与美国经济衰退的风险,而这可能是全球范围内经济滞涨的两大主要前导因素。或许人们可以认为A股市场仍然处于长牛短熊之中,但恰恰相反,时间框架内的图谱显示,上证指数正处于明显的下行趋势和熊市前景之中,虽然它具有潜在的逆势反弹与短期牛市倾向。涨跌是市场的常态,总有逆向的波动存在于之中。这是一个动荡不定的市场,在一个恰当的时间周期之内,对投资标的、投资组合进行审慎估值,是至关重要的。.

附件

1.jpg (89.71 KB)

2008-4-13 22:58

1.jpg

TOP

Chart 1 is a monthly chart of the Shanghai Stock Exchange Composite Index in comparison with the Nikkei Index and the NASDAQ index. After the 1990 Nikkei Bubble and the 2000 NASDAQ Bubble, the Shanghai Index in 2007 formed another biggest stock market bubble in recent history. Both the Nikkei Index and the NASDAQ Index had more than 75% retracement from their bubble highs, and both indexes are still far below their all-time highs after the bubbles burst so many years. A tipycal landing zone for this kind of high flyers is in a range of about 70% retracement (plus/minus 15%). So far the Shanghai Index has had just 46% retracement from its spike high of October 2007. There is still more downside risk ahead of this index.
  
  图一:上证指数月K线图与日经指数和纳斯达克指数的对比图。继1990年日经指数泡沫与2000年纳斯达克泡沫之后,上证指数在2007年形成了近期历史上另一个巨大的股市泡沫。日经与纳指均出现了自泡沫顶峰水平75%的回落,并且两个指数在其泡沫破灭这么多年之后,至今仍远远低于其历史高点。对于这样的泡沫,一个典型的指数着陆区间是自高点回落70%正负15%。迄今为止,上证指数仅从其2007年10月的高点下跌了46%,(因此)该指数仍存在不小的向下调整风险。.

附件

2.jpg (96.22 KB)

2008-4-13 22:59

2.jpg

TOP

Chart 2 is a weekly chart of the Shanghai Stock Exchange Composite Index. The Chinese stock market has entered in a major bear market with a growing risk of worldwide stagflation. The long-term picture is bearish as long as it moves below the downtrend line. It may bounce off the recent low to retest the warning line.
  
  图二上证指数周K线图,随着世界范围内经济滞涨风险的上升,中国股票市场可能进入一个主要的熊市周期。只要指数运行于下行趋势线的下方,市场就是熊态的。指数可能会从近期低点反弹,以测试(对)压力线(的有效跌破)。.

附件

3.jpg (91.32 KB)

2008-4-13 23:00

3.jpg

TOP

Chart 3 is a daily chart of the Shanghai Stock Exchange Composite Index. Here is a speculation of a Head-and-Shoulders pattern. Once the decline is suspended or exhausted by the support zone, a counter-trend rally into the Right-Shoulder phase could be the next.
  
  图三是上证日线图,存在走成头肩顶的可能,一旦跌势在前期支撑区域被遏制,指数可能在下阶段反弹形成右肩。.

附件

4.jpg (99.56 KB)

2008-4-13 23:01

4.jpg

TOP

Chart 4 is a daily chart of the Shanghai Stock Exchange Composite Index. It is a speculation of a short-term bottom reversal suggested by the CCI indicator. It had a one-day surge up but had poor follow-through. We will see if the price is able to stay above the new trendline of the CCI indicator.
  
  图四上证日线图,根据CCI指标,市场存在构筑短期底部的可能。指标出现了一个单日突破但持续性较差,我们将关注指数是否能否维持在新的(CCI上行)运行趋势之上。.

附件

5.jpg (79.83 KB)

2008-4-13 23:01

5.jpg

TOP

Chart 5 is a daily chart of the Shanghai Stock Exchange Composite Index. The 14-day Average True Range indicator is used here to measure and track the volatility. It indicats that the price movement during a day is about 4.9% in either direction. This is a very volatile level. One should be extremely careful to use any kind of leverages with this market, and be sure that your risk tolerance is able to handle this type of turbulent waves.
  
  图五上证日线图,此处使用14日均线来衡量指数的日波动幅度。指标显示在涨跌任一方向上,指数的日波动幅度为4.9%。投资者在这样的市场中应谨慎使用杠杆,并确信在这样剧烈波动的市场中你具有足够的风险承受能力。
此图使用的是4月11日的图表,首见于stockcharts.com.

TOP

看看.

TOP

是哪里的老外分析的? 老美?.

TOP

好可怕.

TOP

为啥说“看看人家老外分析的上证走势图”,你看不到上证走势图吗?这种泛泛的技术术语很高深吗?.

TOP

国外的月亮圆啊.

TOP

我没仔细看,觉得如果这些分析发表在07年11月到08年2月我都由衷地PF啊
8过也许人家现在才解密呢.

TOP

提示: 该帖被自动屏蔽

TOP

回复 12#过路人 的帖子

就事论事,仅就看图说话而言,图二还是说明了一些问题的。

拿图二来说,一个典型的看图说话,6124的量能不济、假翻越;5522的锲形以及随后一周的破位,足可说明转势了。如果心中还有一份风险意识,想想大盘指数两年多涨了6倍,而两市所有的股票,几乎都翻了好几个番 .

TOP

LZ,target line 2750到了,有最新的分析么?.

TOP

下一目标1750,也快了。准的啊.

TOP

发新话题